
Interpreting Your qPCR+NGS Level 2 Report
Urology Example
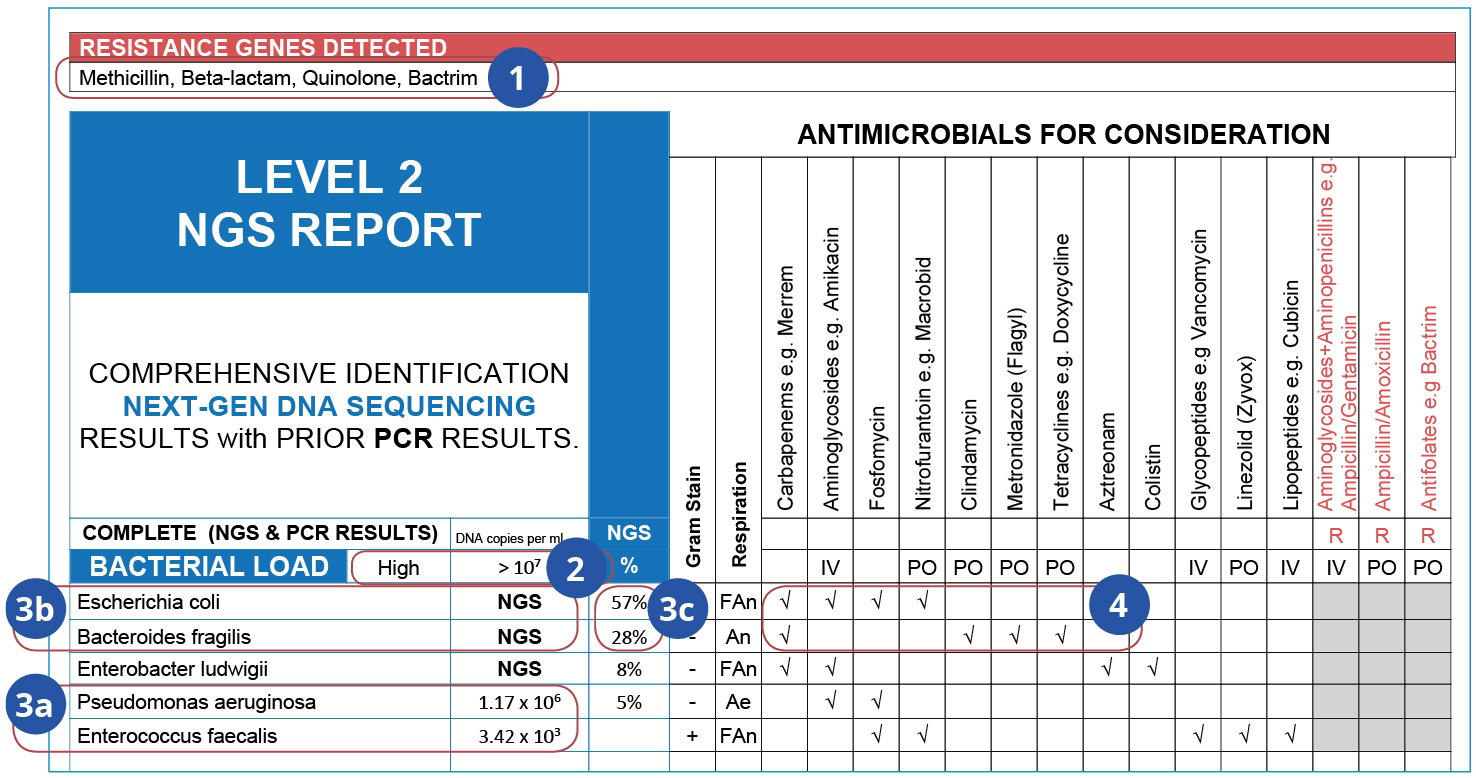
What do these results tell us?
- Antimicrobial resistance genes reveal the resistance potential within a sample’s microbial community, indicating which antimicrobials’ effects would be reduced.
- Bacterial Load represents the number of viable DNA copies per mL.
- A complete list of clinically-relevant microbes detected in the sample:
- Pseudomonas and Enterococcus were detected by qPCR;
- The more dominant E. coli and B. fragilis were only detected by NGS;
- The microbial abundance distribution informs treatment decisions.
- Evidence-based antimicrobials for consideration, based on Sanford Guide and Johns Hopkins Guides (Infectious Disease consultations also available). Not determined by phenotypic susceptibility analysis.
Why was E. coli not detected by qPCR alone?
MicroGenDX has E. coli in its qPCR panel. However, in this sample report, E. coli was not detected in the qPCR panel, and was subsequently detected with NGS. Why? Because qPCR uses very precise primers, so that deviations and mutations can go undetected. According to our analysis, E. coli is missed by qPCR but detected by NGS 18% of the time. In addition, microbial inclusion on a qPCR panel reflects a traditional culture bias, underrepresenting anaerobes and fastidious organisms. The role of these organisms in polymicrobial infection are gaining recognition due to NGS-based research. NGS can accommodate microbe mutation variabilities and is not limited by panel size. Using NGS, physicians receive a true representation of microbial community in the sample.
Wound Example
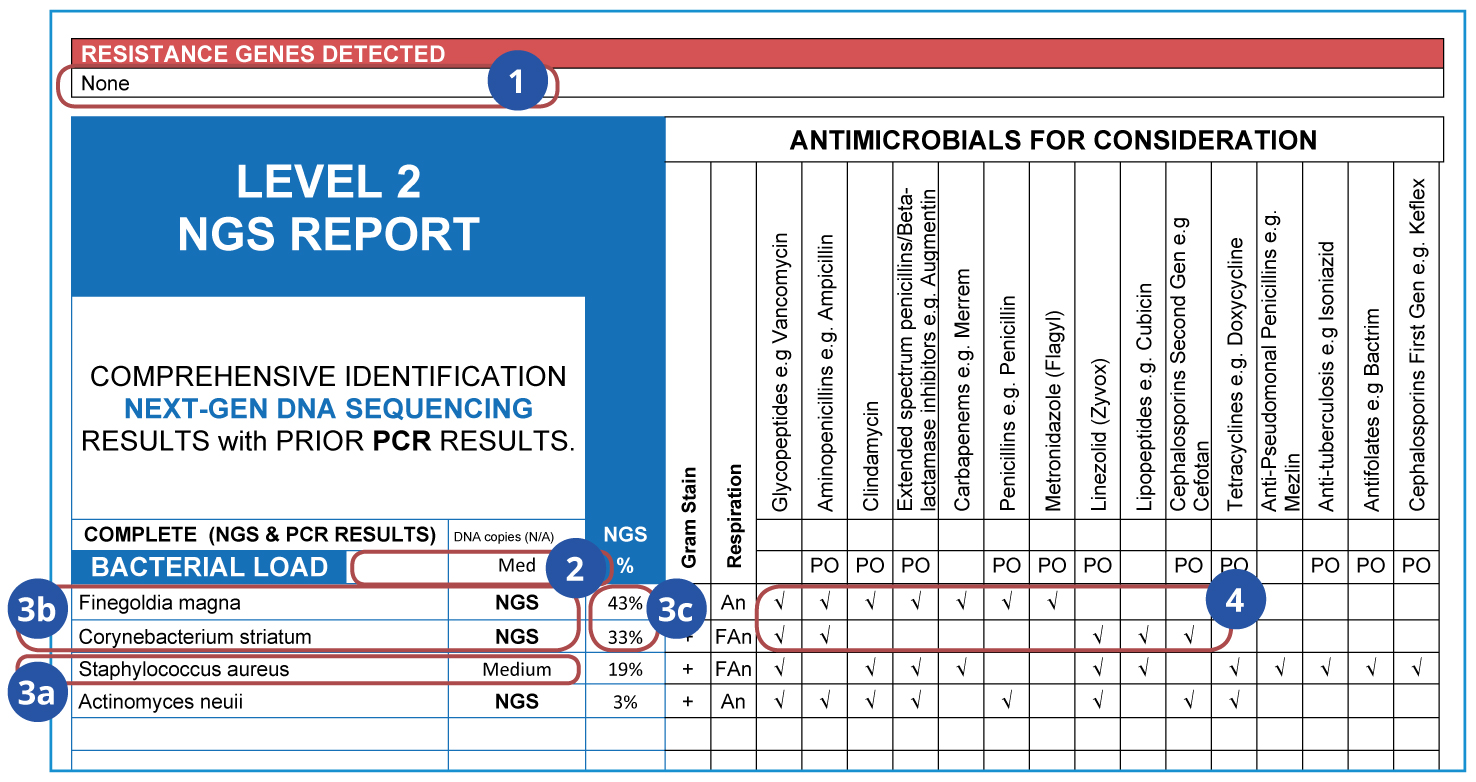
What do these results tell us?
Once they have penetrated the epithelial layer, normal commensal cells always cause destructive infections. The sustained presence of proinflammatory agents due to bacterial colonization causes extracellular matrix degradation, inhibits cell migration, and prevents wound closure.
- Antibiotic resistance genes reveal the resistance potential within a sample’s microbial community, indicating which antibiotics’ effects would be reduced.
- Total microbial load represents the number of viable DNA copies per mL.
- A complete list of clinically-relevant microbes detected in the sample:
- The more dominant Finegoldia magna and Corynebacterium striatum were only detected by NGS;
- Staphylococcus aureus was detected by qPCR;
- Microbial abundance distribution informs treatment decisions.
- Evidence-based antimicrobials for consideration, based on Sanford Guide and Johns Hopkins Guides (Infectious Disease consultations also available). Not determined by phenotypic susceptibility analysis.